Monitoring
The Monitoring page provides real-time insights into all your process instances and tasks. It lets you track overall counts, status breakdowns, time-based trends, and drill down per process model or individual task.
Overview
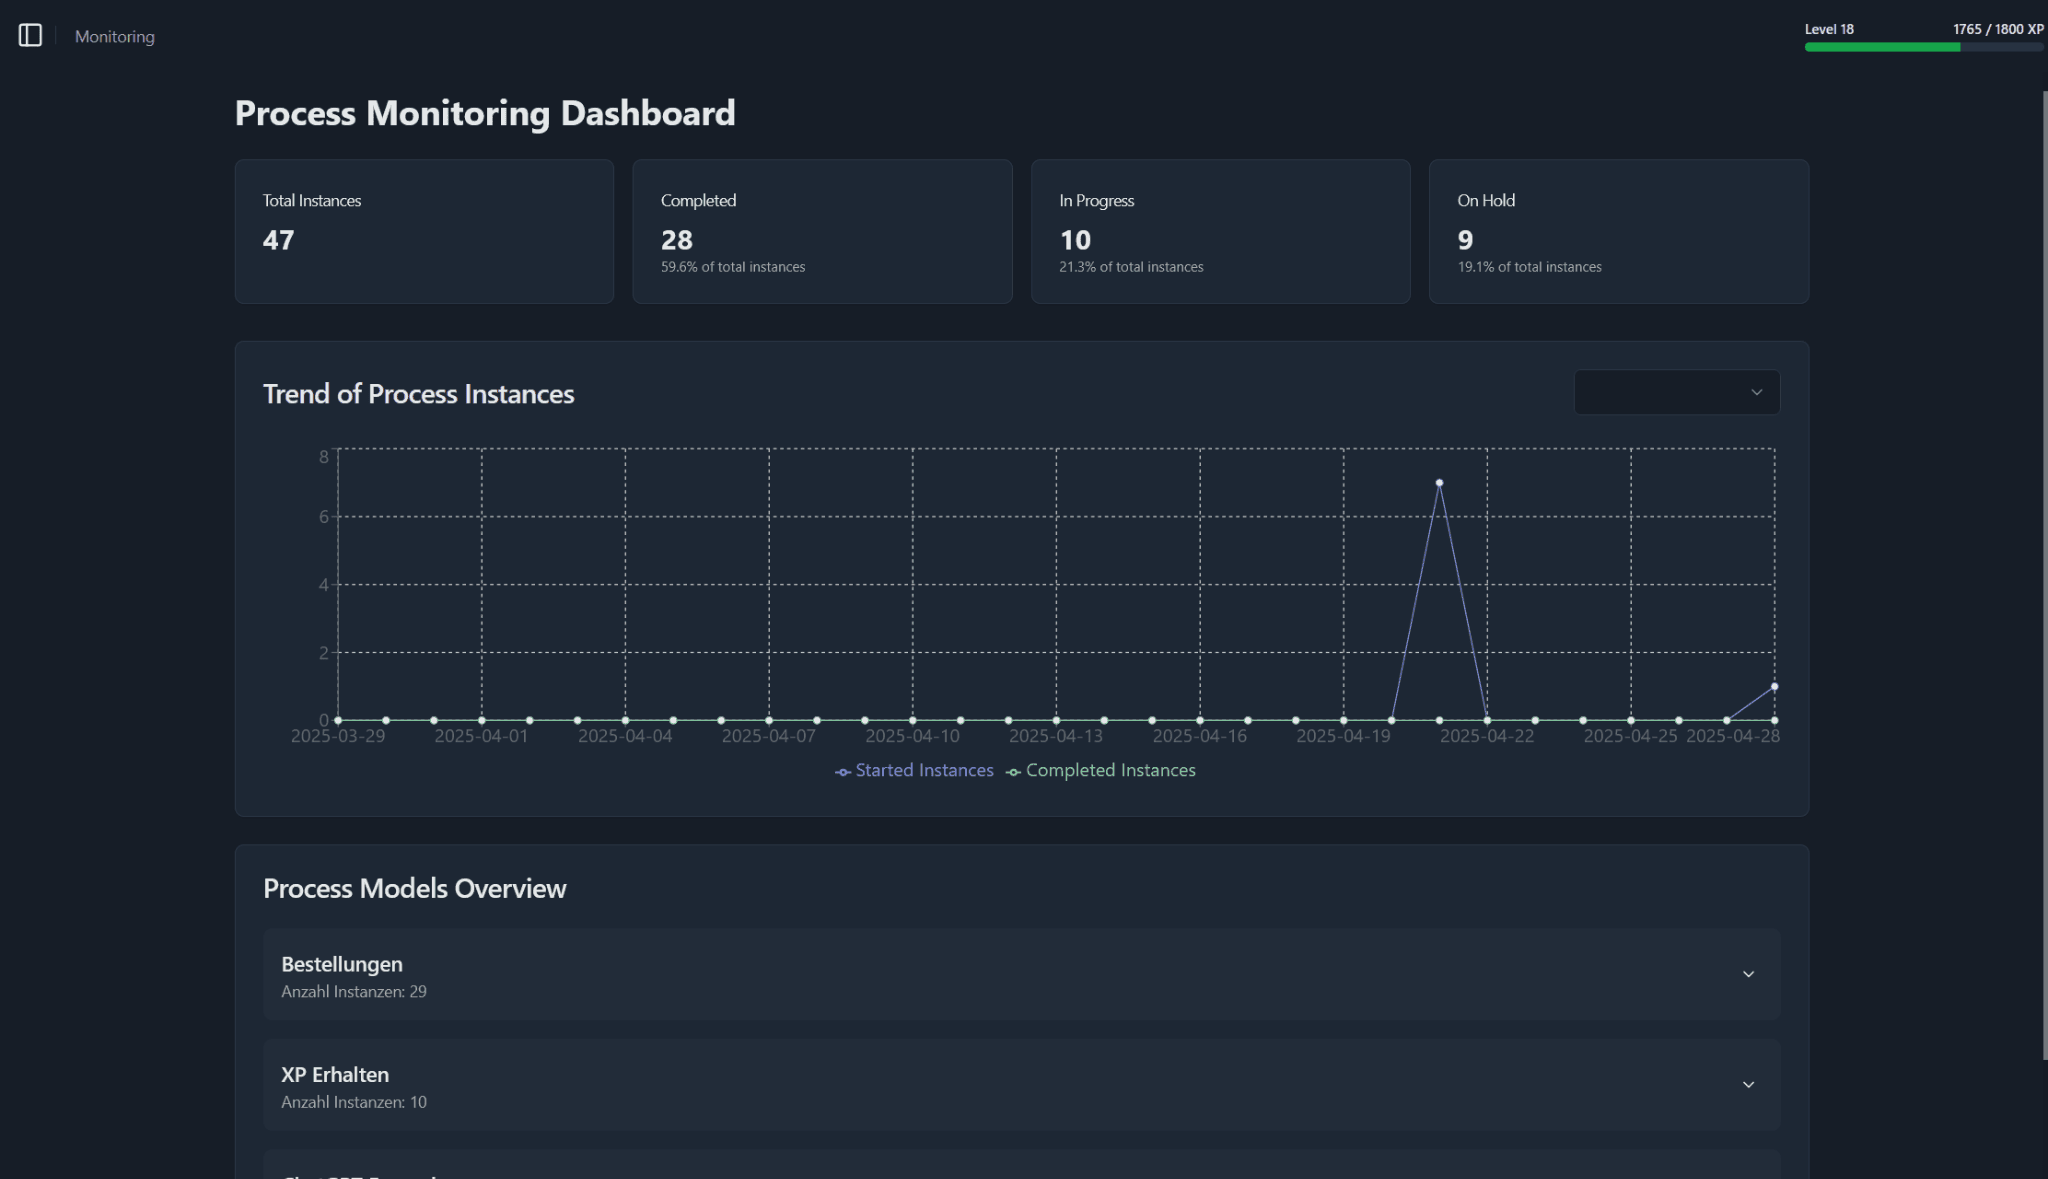
The Monitoring page is your command center for process analytics. At a glance you see total instance counts and status cards, a trend chart of starts vs completions, a collapsible overview per process model, and a full table of all tasks.
Summary Cards
The summary cards provide a quick overview of the current state of your process instances. Each card displays a specific metric related to the instances being monitored.
Total Instances
The total number of process instances being monitored.
Completed
Count and percentage of instances that have finished.
In Progress
Count and percentage of instances still running.
On Hold
Count and percentage of instances paused or waiting.
Trend of Process Instances
A time-series chart showing Started Instances vs Completed Instances over your chosen date range. Use the dropdown in the top-right to switch time windows or focus on a particular process model.
Process Models Overview
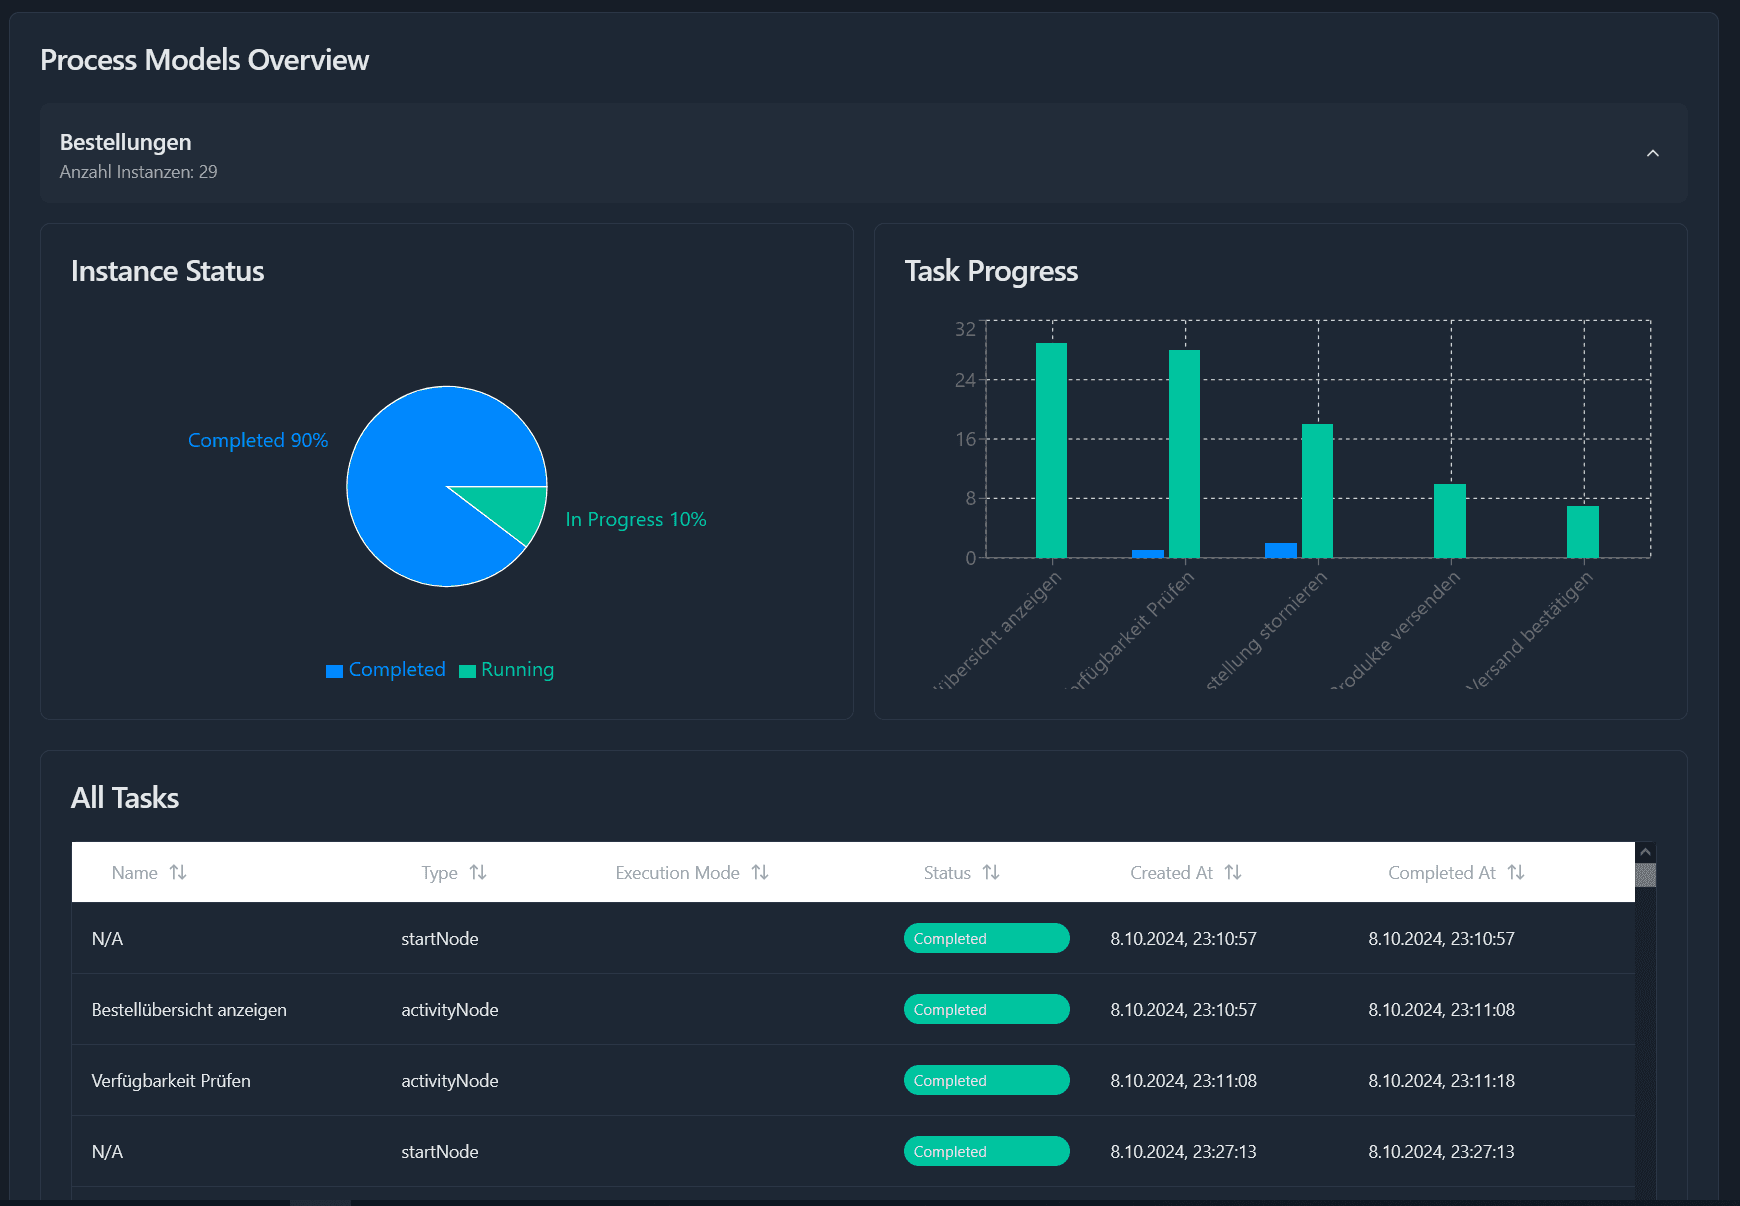
The Process Models section provides a detailed overview of all your process models. Each model is represented by a card that displays key metrics and allows you to drill down into specific instances.
Click the card with the desired process name to reveal the following information:
- Instance Status: A pie chart of Completed vs Running (In Progress) instances.
- Task Progress: A bar chart comparing the number of Running vs Completed tasks for each activity node.
- All Tasks: A table listing all tasks related to this process model with more details like type, execution mode, status, and created at date.